

Key Takeaways
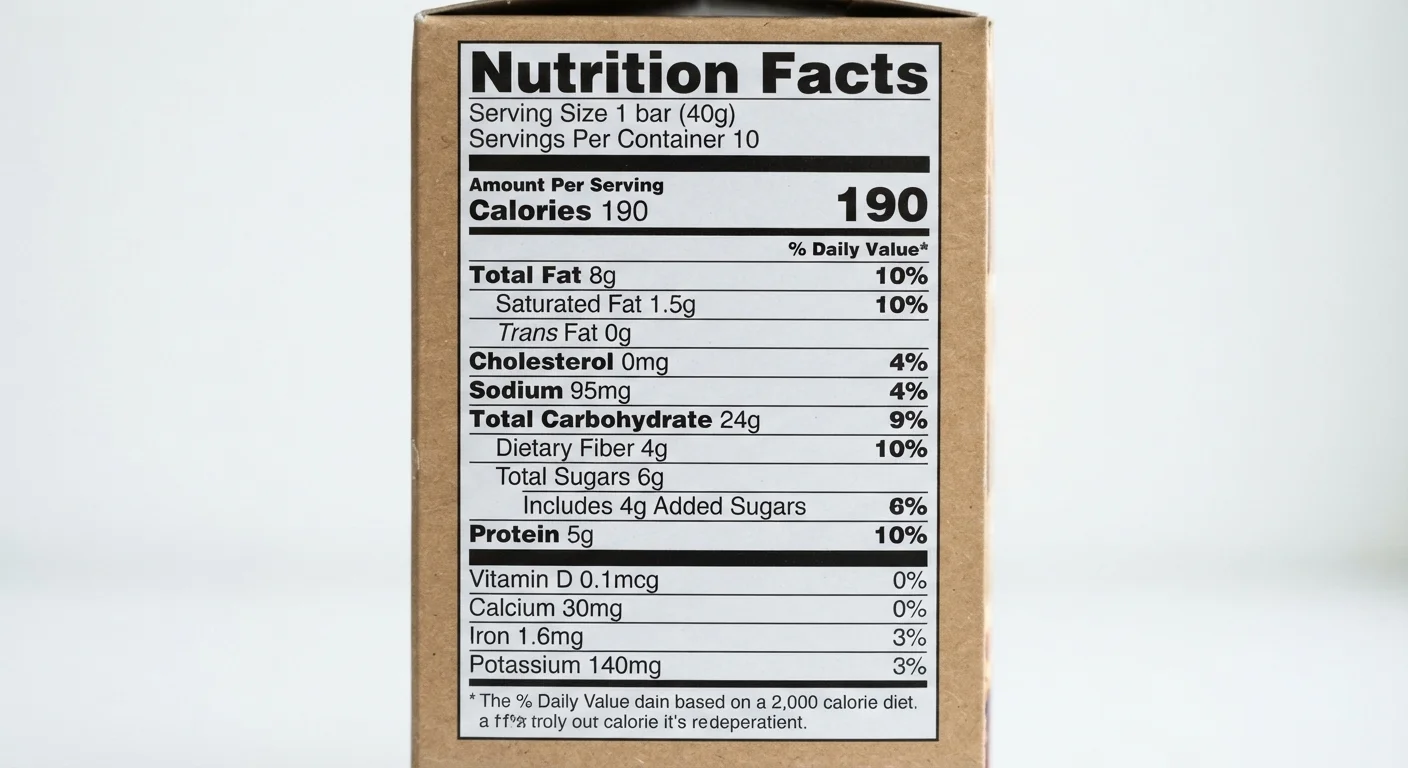
- Grams listed on a Nutrition Facts panel represent measured amounts of fat, carbohydrate, and protein per serving.
- Daily Values are based on a 2,000-calorie reference diet set by the FDA, not a personal prescription.
- Each macronutrient provides a set number of calories per gram: fat 9, carbs 4, protein 4.
- Serving size is the anchor of the entire label — misreading it skews every other number.
- Sub-categories like saturated fat and dietary fiber appear beneath the main macronutrient lines for deeper detail.
What you will need
Why the Nutrition Facts Panel Is Built the Way It Is
The Nutrition Facts label found on packaged foods in the United States is governed by the Food and Drug Administration (FDA). Its current format — updated in 2020 — was designed to give consumers quick access to the information most relevant to public health. Macronutrients occupy the most prominent rows because they are the primary source of dietary energy and because their balance has well-documented effects on long-term health outcomes.
Understanding the label starts with recognizing that it is a standardized snapshot of a single serving, not the entire package. Every gram listed, every percentage shown, and every calorie counted assumes you are eating exactly the declared serving size — which may differ significantly from how much you actually consume. For a broader view of how macronutrient proportions play out across entire eating patterns, see our article on how different dietary patterns divide the plate.
The Math Behind the Calories Line
The total calories shown on a label are calculated by multiplying fat grams by 9, then adding carbohydrate grams multiplied by 4, then adding protein grams multiplied by 4. These multipliers — known as the Atwater factors — are the internationally recognized standard for estimating food energy. Minor rounding at each step means your manual calculation may be off by a few calories, which is normal.
How to Read Each Macronutrient Row
Once you understand the structure, interpreting the numbers becomes straightforward. The three core macronutrient rows — Total Fat, Total Carbohydrate, and Protein — each report a gram amount and, for fat and carbohydrate, a corresponding % Daily Value (% DV). Protein does not carry a % DV unless the product makes a protein-related nutrient claim.
Locate and confirm the serving size
Find the Serving Size line at the very top of the panel, listed in a common household measure (e.g., 1 cup, 3 crackers) alongside a gram or milliliter equivalent. Every number that follows is calculated for this quantity only. If you eat two servings, all gram amounts and calories double.
Read Total Fat and understand the 9-calorie rule
The Total Fat row shows grams of all fat types combined. Fat contributes 9 calories per gram — more than twice the calorie density of the other macronutrients. Multiply the gram amount by 9 to verify the fat-derived calories independently. Below Total Fat, look for Saturated Fat and Trans Fat as sub-items within that total.
Read Total Carbohydrate and its sub-categories
The Total Carbohydrate row covers all carbs: starches, dietary fiber, and sugars. Carbohydrates contribute 4 calories per gram. Sub-items include Dietary Fiber (which most Americans under-consume), Total Sugars, and Added Sugars — the last being sugars introduced during processing rather than those naturally present in the food.
Read Protein and note its limited % DV display
The Protein row reports grams per serving. Like carbohydrates, protein supplies 4 calories per gram. On most labels, no % Daily Value appears next to protein because the FDA requires that figure only when a protein claim is made on the packaging. To estimate protein's calorie contribution, simply multiply grams by 4.
Use % Daily Value as a relative benchmark, not a personal target
The % Daily Value column helps you compare foods and assess whether a serving is high or low in a given macronutrient relative to FDA reference amounts. Use 5% as a threshold for 'low' and 20% for 'high.' Remember that the 2,000-calorie baseline may not match your own needs — the percentages are a comparison tool, not a prescription.
For those monitoring specific dietary goals, reading a nutrition label for weight-conscious eating walks through how label data applies to different health objectives.
After working through the main rows, notice that sub-categories appear indented beneath each primary macronutrient. Saturated fat and trans fat break down the fat figure; dietary fiber, total sugars, and added sugars break down carbohydrate. These sub-entries are informative rather than additive — they are already counted within the parent number above them.
For a practical walkthrough of the full label in context, reading a nutrition label without getting lost in the numbers provides additional detail on sections beyond macronutrients.
Where Daily Values Come From — and What They Mean
The % Daily Value column answers the question: how much does one serving contribute toward a full day's intake? The FDA bases Daily Values on a 2,000-calorie-per-day reference diet, established not because 2,000 calories is the right amount for every person, but because it is a convenient benchmark for label standardization. Actual calorie needs vary by age, sex, body size, and activity level.
For fat, the Daily Value is 78 grams; for total carbohydrate, 275 grams; protein does not have a declared Daily Value on most labels. A % DV of 5% or less is generally considered low for a given nutrient, while 20% or more is considered high — a quick-reference rule endorsed by the FDA for scanning labels efficiently.
If you want to translate this label knowledge into real meal planning, our guide on building a balanced plate offers evidence-informed strategies for distributing macronutrients across daily meals.
This article is for general informational and educational purposes only and does not constitute medical or dietary advice. Individual nutritional needs vary. Consult a registered dietitian or qualified healthcare professional for personalized guidance.